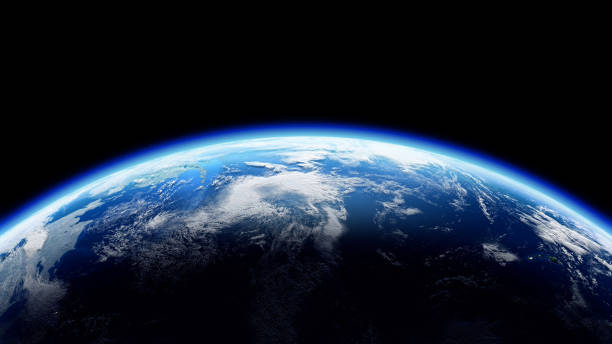
Earth at Night

Clima

The global climate of Earth includes long-term patterns of temperature, humidity, wind, and precipitation that vary by region, influenced by greenhouse gases like CO2 and CH4, leading to global warming and extreme weather events. Current climate data can be accessed from resources like NOAA and NASA, providing vital information on temperature, humidity, and greenhouse gas levels. Utilizing APIs, developers can retrieve and display this data to understand climate dynamics and address climate change challenges effectively.
Latest Video


Explore

...
User Dashboard

The dashboard lets users select regions and greenhouse gases to view climate change summaries and data.

Go somewhere
...
Check Weather

The live weather app offers real-time updates and forecasts for your location, keeping you informed about current conditions.

Go somewhere
...
Causes & Effect

Greenhouse gas emissions cause global warming, leading to climate change and extreme weather.

Go somewhere

Carbon Dioxide over the time

The line chart illustrates monthly trends in carbon dioxide (CO2) emissions, showing average atmospheric CO2 concentrations in parts per million (ppm). It highlights seasonal fluctuations, with peaks during winter months due to increased fossil fuel consumption for heating and declines in warmer months as vegetation absorbs CO2 through photosynthesis. This visualization emphasizes the impact of industrial activities and natural processes on CO2 levels, making it a valuable tool for researchers and policymakers to analyze trends and develop strategies for mitigating climate change.

Oxygen (O2) over the time

The line chart illustrates the levels of oxygen (O₂) measured in parts per million (ppm) over the years from 2018 to 2022. Oxygen is essential for the survival of most life forms on Earth and plays a vital role in various ecological and atmospheric processes. The chart reflects the stability of oxygen levels during this period, showcasing relatively consistent readings. This stability is attributed to the balance between photosynthesis, which produces oxygen, and respiration, which consumes it. Understanding these dynamics is critical for assessing the health of ecosystems and the impacts of climate change on oxygen production and consumption. Monitoring oxygen levels helps in evaluating air quality and ensuring a sustainable environment for future generations.

Methane (Ch4) over the time

The line chart displays the levels of methane (CH₄) in parts per billion (ppb) over the years 2018 to 2022. Methane is a potent greenhouse gas with a global warming potential significantly higher than carbon dioxide over a shorter time frame. The chart indicates a gradual increase in methane levels during this period, highlighting ongoing concerns about its contribution to climate change. The rise in methane emissions can be attributed to various sources, including agriculture, landfills, and the oil and gas industry. Monitoring these levels is crucial for implementing effective climate policies and mitigating the impacts of climate change.